Observability Signals: choose wisely
A quick review of the "three pillars" of observability: logs, metrics, and traces- their strengths and weaknesses, how to match the right signals to particular use cases.
The fun part: we'll explore this via a real-world app, adding observability as it grows from a small monolith into a large, microservices architecture.

I spend quite a bit of time helping developers figure out how to make sense of telemetry data they've collected. Often this is showing them to navigate our observability tooling, how to think about visualizing data, or just tossing some saucy query tricks into the mix.
Sometimes though, I find that their telemetry is... ill-conceived. I occasionally find metrics being written like they were a point-in-time event, missing context in logs because someone was worried about adding too much cardinality, or log lines with variable and static context needlessly mashed together. Alas.
This kind of thing makes me wish I'd had a chance catch them earlier, when they were just beginning to consider instrumentation choices.
Given how often this happens, I've built up some insights on some of the most common misconceptions about the different observability signals, what makes them different from one another, and why you'd choose a specific one for a given situation.
The basics: observability signals (a.k.a. the "three pillars")
Let's review: what do we mean by "observability signals"? We're talking about the venerable "three pillars" of observability: logs, metrics, and traces.
- Logs are streams of text that usually represent individual events. Logs are most powerful when they're structured (e.g. JSON or otherwise parsable); they can be arbitrarily "wide" and can have many, high-cardinality fields (no limit on the number of possible values per field).
- Metrics are series of numeric measurements over time, labeled with key/value pairs. Metrics represent aggregations of data (e.g. sums, counts, percentiles) and not individual events. Time-series databases store metrics in an extremely compact and cost-effective way, with the tradeoff that they require relatively low cardinality value labels (a low number of unique combinations of labels) to operate efficiently.
- Traces are a special kind of logs that are rigidly structured to provide context about a set of related operations that occur across a (usually distributed) system. Individual events in traces are called "spans", which represent operations with a start/end time, and are linked together in a nested structure via correlating IDs. Spans can also contain arbitrarily wide, high-cardinality fields.
There's other, more exotic signals (e.g. profiles) but we're going to stick to meat and potatoes here.
Enough with the theory already
Blah, blah, blah. I'm dying for a real-world example. How about you?
Introducing PetFace
Let's say we've got a startup idea for a mobile app: it allows users to select pictures of their pets, upload a video, and then some fancy AI processes them and substitutes the faces of anyone in the video with the pets' faces. Hilarity ensues.
Let's call this app "PetFace".
Don't steal my app idea. This is going to make me rich.
The architecture of PetFace
For the supporting backend of this app, let's build a little API server which does the following:
- receives pet pictures and a video from the mobile app via an API
- runs the fancy generative AI to replace human faces with pet faces
- writes the processed video to S3
- updates a database record to indicate the video processing is complete
The app would poll the API server to check the status of the video processing.
Making PetFace observable
Let's start with some nice, structured logs
OK, let's say we've got the MVP of the app done, and now we want to set up some observability.
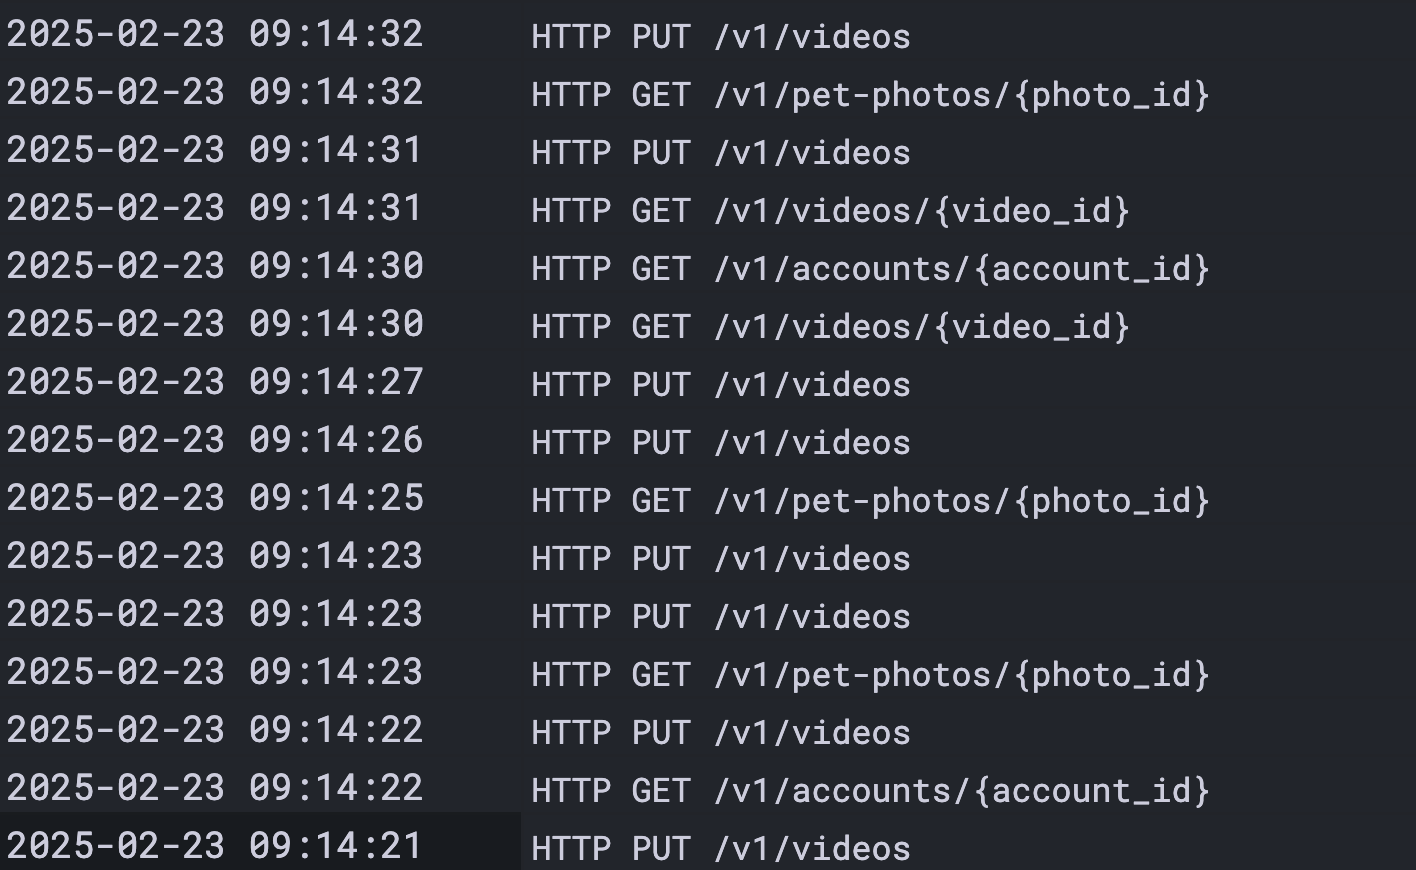
99% of the time, the first thing to do is just sprinkle in some logging. Here's an example of some nice, structured log events:
These are multi-line and indented for readability. Don't actually write your logs with line breaks.
<ts>
  level=info
  event=HttpRequest
  message="POST /v1/video"
  status=201
  request_id=abcdefg
  pet_pics_count=3
  duration_ms=7830
  user_id=12345
  instance=api-3
<ts>
  level=info
  event=VideoReceived
  message="video uploaded successfully"
  request_id=abcdefg
  pet_pics_count=3
  duration_ms=7830
  user_id=12345
  instance=api-3
<ts>
  level=info
  event=VideoProcessed
  message="video processed successfully"
  request_id=abcdefg
  duration_ms=13204
  user_id=12345
  instance=api-3
We'll also need some additional event types (e.g. "VideoSaved", "DatabaseUpdated") and probably also a message type for errors:
<ts>
  level=error
  event=VideoProcessingError
  message="video processing failed: too many pet photos"
  request_id=abcdefg
  user_id=12345
  instance=api-3
  error=ETOOMANYPETS
As we build, test, and troubleshoot the PetFace backend, these log messages will be invaluable for understanding what's going on for any individual request.
Deriving metrics from logs
As PetFace's usage begins to grow, scanning raw log lines with our eyeballs to try to determine the health of the backend isn't going to cut it. To reason about large amounts of data, we're going to want to use the magic of math to extract aggregate, numeric time-series we can visualize.
In this case, we may want to start drawing graphs to represent:
- How many requests are we getting per second?
- What are the average, 95th percentile, and 99th percentile of video processing time?
- What is the percentage of requests that result in an error?
Luckily, our logs already contain all the data we need in structured fields. If you've got a log query language that supports grouping and some aggregation functions, you can generate time-series from your logs.
Here's an example: Here we're using LogQL (the query language for Loki) to get requests per second with LogQL. First, here's a basic log selector expression that gets the request logs for PetFace in production:
# get production logs for PetFace
{service_name="PetFace",env="production"}
  # parses the key/value pairs
  | logfmt
  # select only HTTP request logs
  | event="HttpRequest"
Now we can convert it into a single metric series by wrapping it in rate() and sum() functions to calculate requests per second over time:
sum(
  rate(
    {service_name="PetFace",env="production"}
      | logfmt
      | event="HttpRequest"
      [$__auto]
  )
)
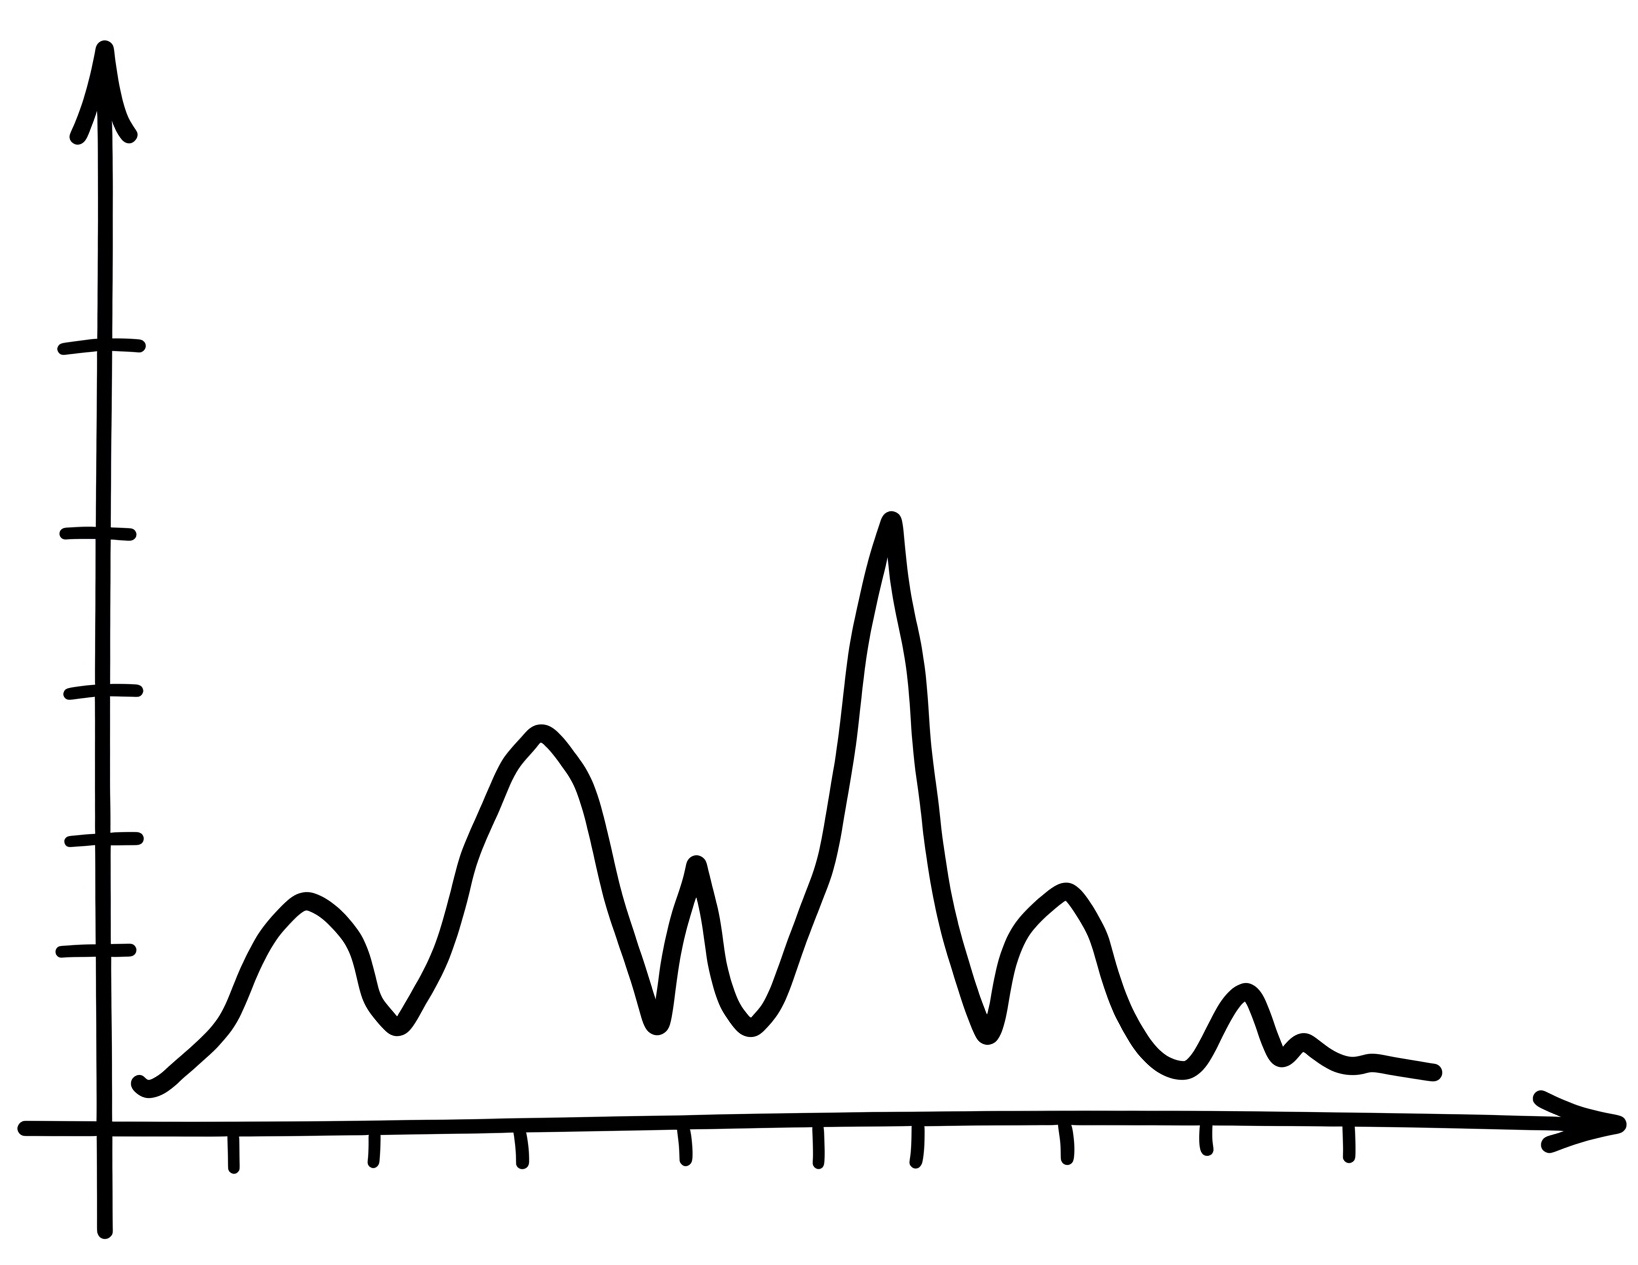
Voila! Now we can use our visual cortex (a.k.a. the GPU inside our brain) to comprehend tons more data than we could possibly hope to by scanning through log lines! We can spot trends, anomalous blips, and build an intuitive sense of what healthy vs unhealthy looks like for our app.
This helps illustrate one of the most fundamental misconceptions about metrics, and how they differ from logs:
- A log line is an event: something happened at one point in time.
- A metric timeseries is a long-running series of measurements over time that represent all the events that happened since the last data point
Logs get expensive at scale
PetFace is blowing up! We're scaling our backend dramatically, and our bill for logs storage is killing us. Logs are super powerful and flexible, but they cost a lot; not just for storage, but also for our code to generate, serialize, buffer, write to stdout, and ultimately harvest and transmit to our observability backend.
But we're using the logs to generate metrics that have become really, really valuable. We've using them to drive alerts to tell us when something has gone off the rails, to project our growth, and to tune our system. We can't live without them.
Do metrics aggregation directly in the app
What if, instead of generating the metrics from the logs, we just do the metrics aggregation directly in our app? This would not only save the cost of the logs storage, but also remove all the overhead of generating the logs from the app.
For example: to track request rate per second, we could just have an integer counter that we increment on each request, and then send the sum total to a timeseries database at a regular interval (e.g. 1 minute).
Timeseries databases are incredibly cheap to run compared to log aggregators. If we are collecting metrics directly, we can decrease the log level (i.e. change a setting to only emit log lines with level=warning or above), and save a ton of money on log storage, without losing these critical metrics.
While this is a dramatic cost optimization, we should note the tradeoff: replacing logs with metrics is a lossy conversion. Metrics don't have the rich, high-cardinality context that you get with logs.
For example, you can't look at a blip in an "error rate" time-series and use it to diagnose a specific failed request- that information was lost when the metric was aggregated.
Metrics are a key lever available to you to manage observability costs: as your system becomes more mature, you can use metrics to distill down the most important indicators of your system's health. This can allow you to tune down the verbosity of your logs, saving lots of money.
How to use metrics completely wrong
Let's say we've hired a bright-eyed young college intern at PetFace, and have asked them to implement a new feature: a button which allows a user to share their pet-faced videos with their friends by email.
This intern is super talented, and builds the feature in no time. The final requirement is to add some observability to track adoption of the new feature, so they add a new line of code which gets run once a user clicks the "send" button.
The intern figures that this metric will be most useful if it contains the full context of the email sending function:
def send_video_to_friend(user_id, video_id, friend_email):
    # build content for an email to the user's friend
    email_body = build_email_body(user_id, video_id)

    # Send the email
    result = send_email(email_body, friend_email)

    metrics.increment_counter(
      name="petface_friend_email_sent",
      labels={
        "user_id": user_id,
        "video_id": video_id,
        "friend_email": friend_email,
        "success": result.success
      }
    )
Can you spot the problem?
I've mentioned previously that metric labels should be low cardinality. In this example, we've introduced very high cardinality: there's going to be a new, unique metric series for every single combination of user_id, video_id, and friend_email, which all have unbounded possible values.
Egads! That's effectively infinite cardinality, which will rapidly bring any time-series database (e.g. Prometheus, InfluxDB) to its knees- or cause your observability vendor bill to explode.
The metrics code above isn't even really creating "series", since it's emitting only one data point per unique combination of labels. The whole point of using time-series is to track the change in a measurement over time.
When you have "series" with one data point each, that's a strong smell you're doing something wrong.
Metrics defined in code are for answering questions about aggregate quantities, not individual events. Here's some questions we could answer effectively with metrics:
- How many video emails are being sent per minute?
- What percentage of email sending attempts fail?
To answer these, we don't need user_id, video_id, or friend_email; we only need to count the number of sent emails, including the label success, which has only 2 values: true or false. This results in only 2 series. That's wicked cheap!
When you define metrics in code, you're deciding in advance what questions you want to answer. They are not useful for answering arbitrary, novel questions.
Since video sharing emails are a brand new feature, we may not have any idea what questions we want to answer up front. We may want to a series of more ad-hoc, open-ended questions like:
- Which users send the most emails? Does it correlate to their subscription tier? Country of origin? Length of the video?
- Which users are associated with the highest send failure rates? What could be causing that?
This would have been an excellent usage of a log line. You can include all kinds of context in the log line, and then use your observability backend tools to slice and dice the data to answer a much broader range of questions compared to the metric.
Here's the same code, after a review from a seasoned mentor:
def send_video_to_friend(user_id, video_id, friend_email):
    # build content for an email to the user's friend
    email_body = build_email_body(user_id, video_id)

    # Send the email
    result = send_email(email_body, friend_email)

    metrics.increment_counter(
      name="petface_friend_email_sent",
      labels={
        "success": result.success
      }
    )

    logger.info(
      event="FriendEmailSent",
      message="friend email sent",
      labels={
        "user_id": user_id,
        "video_id": video_id,
        "friend_email": friend_email,
        "success": result.success
      }
    )
Tracking the metric petface_friend_email_sent would cost pennies regardless of how wildly successful this feature becomes, while the cost of the log line would scale linearly with number of requests- and could get expensive at high volumes.
Did you forget about traces?
Up to this point, PetFace was essentially a single, horizontally scaling backend API server. While traces can be used in a monolithic app (e.g. to visualize key functions in the call stack), their utility is more limited.
Let's imagine PetFace has gone absolutely gangbusters, had a successful IPO, and now has 15 different dev teams working on dozens of different supporting microservices: advertising placements, data collection for model training, social networking features, etc. We've even got yoga classes and catered lunches two days a week!
At this scale, system failures are a lot harder to diagnose with logs or metrics. There's all kinds of complex, second-order effects, backpressure, and subtle failure modes across multiple services in the system.
For example, when the video processing microservice's p95 performance suddenly takes a nosedive, everyone starts scrambling around trying to figure out the root cause, but it's hard to get a broad view of the whole system when each service's logs and metrics are separate.
This is where tracing absolutely shines.
Let's take the example above, but imagine we have our system instrumented with OpenTelemetry tracing, pointing to a backend like Honeycomb or Grafana Tempo. These tools allow someone to quickly identify a few example traces representing the slow video processing requests, drill down into the spans in the trace- across all microservices transitively involved in the operation. Spans are visualized as a tree, where the width of each span represents duration, and child operations are nested recursively underneath.
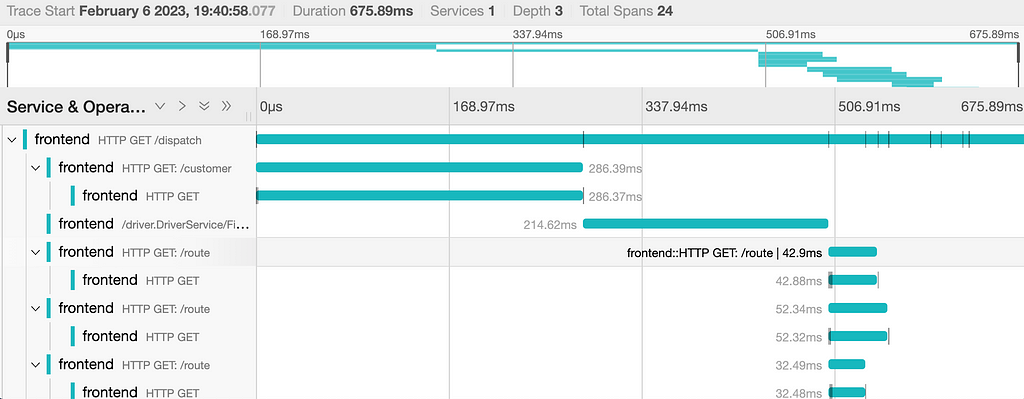
Behold, the power of the correlation ID!
Now you can easily see that, 3 services deep, there's a slow PostgreSQL request from the ad placement service. Oh crap- it looks like there's lock contention in the database during high load!
Wow- traces are amazing. I mentioned before that the spans that make up traces are basically just a special, rich type of log, and that metrics can be derived from logs. So if we have tracing... why would we want to use any other signal?
The 3 signals are complementary
There's a few reasons why the 3 different signals are complementary:
- Traces have roughly the same unit economics that logs do- they can get very expensive at scale. To make traces more affordable, many companies will do random sampling of traces (e.g. collect 1 out of every 5 traces), which will reduce the cost significantly, but also make the traces a lot less useful for forensic use cases (e.g. diagnosing a particular bad request). Sampling is also complex, and can be error prone.
- There's a bunch of use cases that traces don't do a good job of handling today (e.g. long running operations, async operations, capturing state from a crash, representing background processes)
- Traces are a lot newer and less mature than logs and metrics; the tooling ecosystems are more limited.
If you're interested in a deeper dive into my opinion that we still need logs and metrics (and why some very smart people disagree with me), check out my previous post: Are we ready for Observability 2.0?.
Cheat sheet
I'll leave you with some quick heuristics to help you match signals to use cases:
When to use logs
- When you're building a new application. Start with structured logs, and log liberally.
- Forever after. Logs are always useful to help ask arbitrary, novel questions of your system.
- When you need the ability to retroactively troubleshoot specific, individual events.
- When you have strict requirements for auditing, security, or regulatory compliance.
- For edge cases that traces don't handle well: capturing crash data, initialization and background processes, correlation of related async tasks, etc
When to use metrics
- To track important numeric indicators of system or business health over time (e.g. request counts, error counts, CPU temperature, WiFi signal strength, request duration distributions) that you probably want to alert on (e.g. request rate drops, error rate jumps)
- When your log volume starts to get expensive, and your system is mature/stable enough to reduce the verbosity/frequency of your logs, and you can fill in the resulting gaps with some key time-series
When to use traces
- When your system grows more complex, especially when you break it up into multiple services (or APIs, databases, etc)
- To provide a deep understanding the behavior and topology of your (usually distributed) system, including the ability to ask ad-hoc, arbitrary questions
- To help understand the performance characteristics of your system, and especially to find the root cause of performance problems
General tips
- If you've already got sufficient visibility into a specific operation from one signal, and another signal would be duplicative, you may want to drop the one that's less rich (e.g. maybe drop a log line if you're already capturing an un-sampled span).
- Don't prematurely optimize for cost; lean on richer signals (traces, logs) and avoid sampling until it becomes an actual problem. The ability to ask ad-hoc questions of your system is very important, especially early in a product's lifecycle.